Monitoring and Optimizing API Gateway with Dashbird
Get started free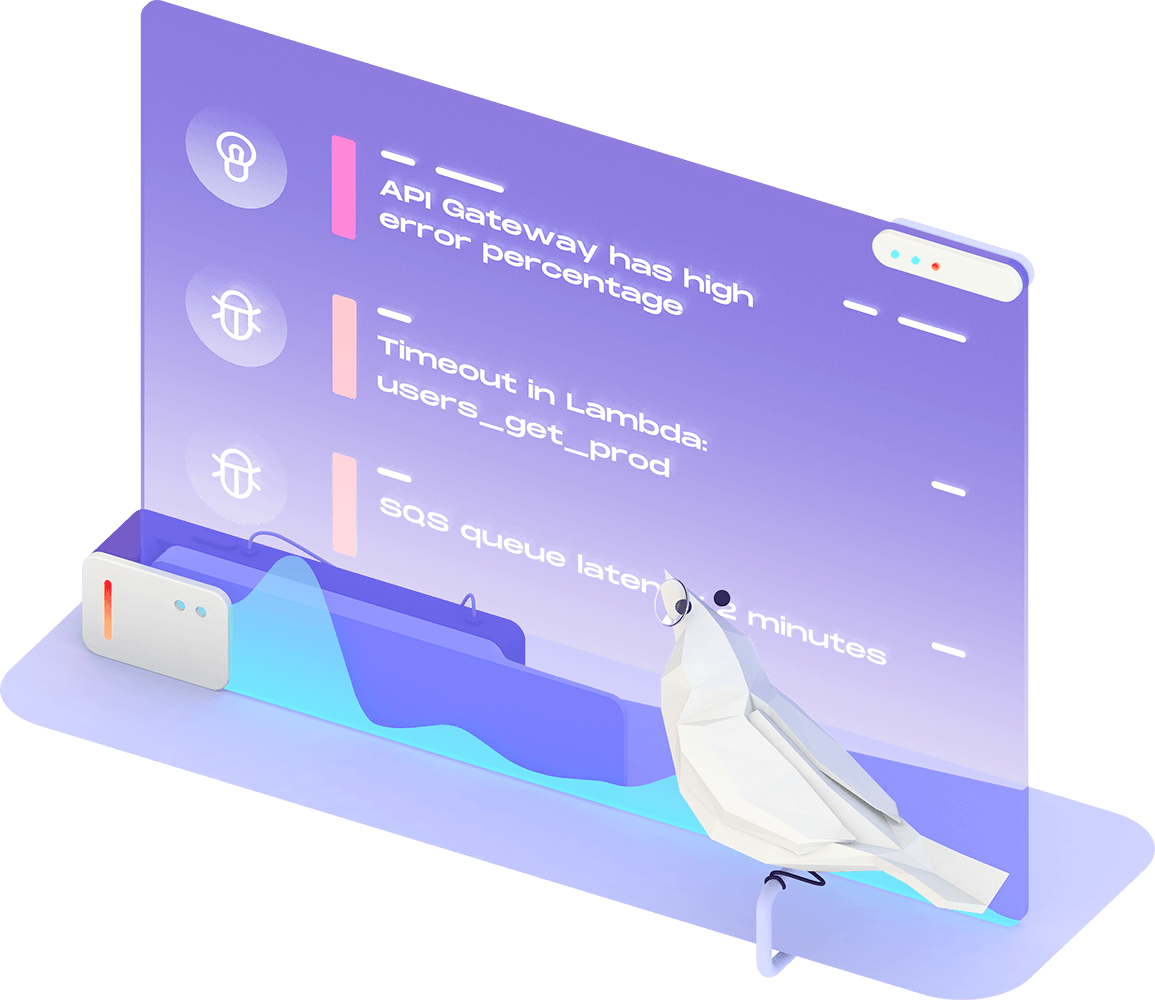
API Gateway is one of the most critical services used in Serverless architecture, managing all interactions between the application and the components behind it. It’s ability to handle huge amounts of data and the new learnings needed to orchestrate it emphasizes the importance of monitoring and error detection. Dashbird’s monitoring and intelligence platform offers detailed observability of your serverless environments, detecting and sending alerts for misconfigurations and optimization opportunities.
API Gateway troubleshooting with Dashbird
All compute data at your fingertips with no setup or management overhead. Use dashboards, search and bubble-up to interrogate your data quickly.
Alert management
Dashbird detects known and unknown failures across all cloud resources and offers a powerful alert and incident management platform to build your on-call process on.
Performance optimisation
Find and solve performance bottlenecks. Understand the implications of code changes and architecture modifications.
Cost optimisation
Monitor the cost of each cloud resource and find out how you can optimize them. Dashbird tells you if you have overprovisioned on unused resources and shows you where you’re losing time and money.

Real-Time & Interactive Data Visualization
Dashbird Atlas gives you the opportunity to visualize your API Gateway as part of the wider Serverless architecture, and how they interact with other services in real-time. You’re also able to drill down into individual components for more detail and insight.
Built for Serverless
Dashbird was designed to support businesses using modern cloud services, whether at the start of their journey or at scale. Features instill confidence to build and operate complex Serverless applications by monitoring, providing observability and insights, and real-time error alerts.
- Quick 3-minute setup
- Zero code changes
- Centralized, easy-to-access data
- Monitoring for errors, cold starts and anomalies
- Automatic alerts already set up
- Customized insights for optimization
- Complex data visualized
- No security or performance implications

The Three Pillars of Dashbird
Centralized Observability and Real-Time Data Visualization
Dashbird automatically discovers and imports data from all Serverless resources used in your environments into one central platform. With easy and quick access to logs, metrics, traces and configuration data, and visualized real-time data, developers gain superior knowledge of their infrastructure.
Automated Failure and Error Detection
Dashbird monitors and detects events including logs, code exceptions, slow API responses, slow queues and failed requests. For any failure or configuration error, a detailed alert will be instantly sent enabling fast remediation.
Actionable Well-Architected Best Practice Insights
Dashbird’s rule engine periodically checks against resource data, and proactively identifies failures, inefficiencies and security and compliance issues. These metrics and insights encourage Serverless Well-Architected best practices and learnings, creating truly reliable, scalable and cost-efficient applications.
The numbers dont lie
Average savings per one developer’s salary based on time they spent on debugging
Hours saved on debugging annually per developer
Happy monthly users


100+ Happy customers